Script logs
When a ClusterScript is executed within a space instance, various information such as messages from $.log() in the script, system statuses, and warnings are generated.
These are called script logs and can be useful for debugging.
Log collection range
By default, only the logs from devices that are Owner are collected and displayed.
If you enable “Show all logs” in the developer menu, all logs within the space instance will be collected.
Viewing logs in the app
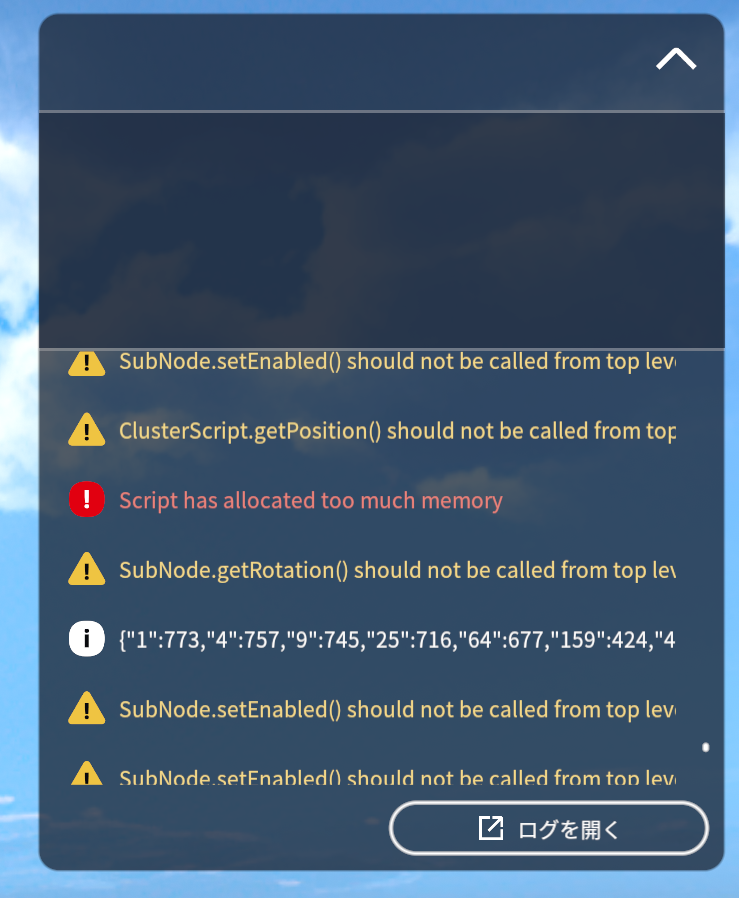
You can check logs within the app. Click “Open Logs” to open the .log file with the default program.

Viewing logs in Creator Kit
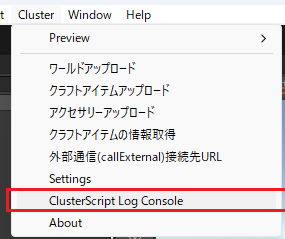
Select “Cluster > ClusterScript Log Console” in Creator Kit to launch the console and start monitoring ClusterScript logs.
In the ClusterScript Log Console window, you can perform the following operations:
Clear
Clears the displayed logs. Cleared content is not removed from the log file.
Load
Loads a log file that you want to display. By default, the log file in the file path is loaded initially.
Incremental search
Enter text in the text box to filter logs.
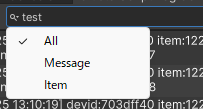
Click the magnifying glass icon to display a menu where you can switch the search target (log message/item name).
Pause Log
Enable this checkbox to pause log updates.
Open Log
Opens the log file in the application associated with .log files.
Log file
Log files contain more detailed metadata recorded as structured logs. The files are located at the following paths:
- Windows:
%userprofile%\AppData\LocalLow\Cluster, Inc_\cluster\ClusterScriptLog.log - Mac:
~/Library/Application Support/Cluster, Inc_/cluster/ClusterScriptLog.log
Each line in the file corresponds to one log entry in JSON format.
dvid(string): Identifier that uniquely identifies the device on which the script was executed within the space instancetsdv(number): The time when the log was output on the device (Unix-time, second)origin(object): Information about the item that generated the logtype(string): Type of logmessage(string): Log message